
It turns out that me tossing in that little stadium statistic in my Corona recap a couple weeks ago (only 15% clear rounds in our division) was just the beginning of something bigger. My barnmates and I got to talking over the weekend about which venues seem to produce more rails in stadium, which ones tend to have “easier” XC, etc etc. Then I starting thinking – surely I can come up with some numbers to substantiate our hypotheses. Lord help us all when I start trying to math.

It took me a really really ridiculously long time but come to find out I CAN actually count, and luckily the internet has a percentage calculator so I didn’t really have to do much of anything except plug numbers in. Praise Google.
So here’s what I did: first I had to figure out what numbers we actually wanted. I decided to only do venues in Area 5, and only calculate statistics for Novice and Training level – the ones I care about. I decided to look at the percentage of clear rounds (jump penalties only – I threw out time penalties for this) for both stadium and XC at N and T at every venue in Area 5. For XC, jump penalites consisted of refusals, retirement, or elimination. I threw out every TE because those are more rider error and therefore not really valid for what I was after, and also threw out W’s because there’s just no telling why people withdrew. For stadium if there was one or more rails, it wasn’t a clear, obviously, but I didn’t factor in time faults for that either.
Then I started adding them up and calculating percentages for each show at each venue over the past two years. I could have kept going back a couple more years for more data, but a) my eyes were already starting to cross with just two years worth of data b) I noticed that the numbers at each particular venue tended to be about the same at every event c) since each venue has at least 2 shows a year I already had a minimum of 4 data sets per venue. Of course, that data can have a lot of factors behind it. Bad weather could lead to a high percentage of problems, or something else weird going on could skew things. For the most part though the numbers were consistent across the board. When I had a percentage for every show at every venue I then went venue by venue and averaged out the percentages to come to one final number. Here’s what they look like
Novice:

There was nothing too surprising to me here. I figured Corona and Greenwood would have the toughest stadium and they did. Good to know Holly Hill is right in there too. Does Feather Creek super glue their rails to the cups?
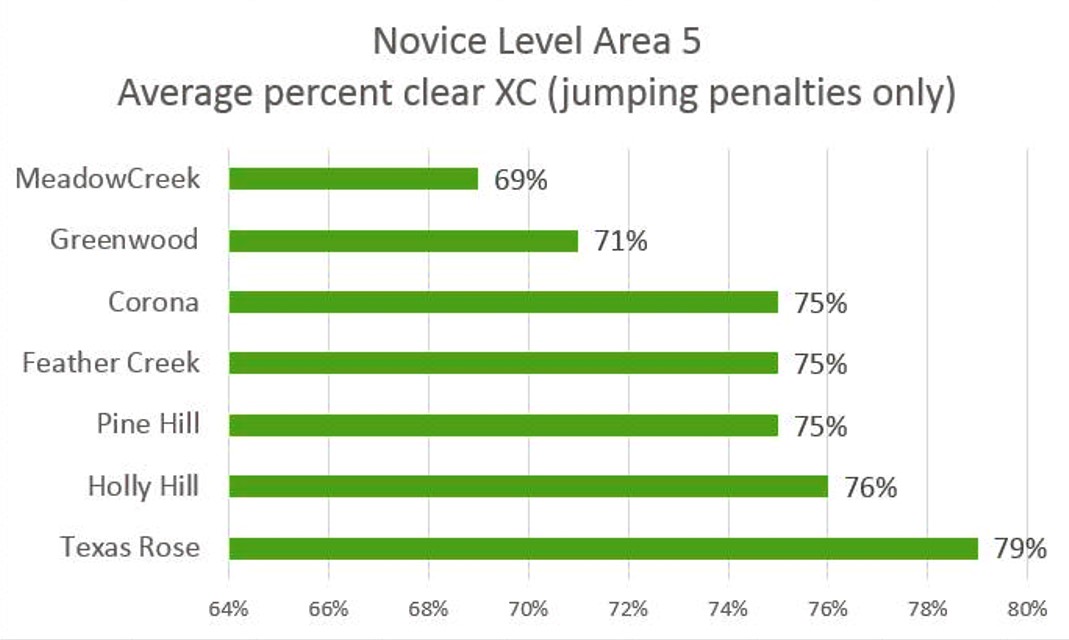
On the XC side of things nothing was particularly surprising either except that Texas Rose had a much higher “Clear Rate” than I expected. But having ridden around it, I can understand why. It’s not small and has some technical questions, but it’s pretty open and gallopy and inviting. It’s also worth noting that there’s only a 10% spread between the highest and lowest percentage of clears – not a very big margin.
Training:

Training was interesting to see too, just because I’ve never really paid much attention to the Training level courses at most of these venues and obviously I haven’t ridden any of them (except MeadowCreek a million years ago). If you throw out the top and bottom numbers in stadium they’re all pretty darn close. Also no surprise that the general Clear Rates for Training stadium are less than Novice. 
The XC I thought was interesting. Holly Hill was far and away the “winner” there, I’m guessing because it’s another open, gallopy course similar to Texas Rose’s Novice. Mental note to also walk the Training course when we’re at Holly Hill for Novice Championships next month… I want to see for myself!
In general these numbers really aren’t that scientific and probably don’t mean a whole lot in the grand scheme of things. But it was interesting to put together, if nothing else, and will certainly make me pay a little bit more attention going forward.
And with that, I have far exceeded my quota of math for the year.


obviously you were bored out of your skull if you voluntarily did MATH. and math of that quantity. unreal. Interesting but unreal 🙂
LikeLike
It was one of those things that I thought would take like half an hour and ended up taking more like 2.
LikeLike
Props to you for your dedication!
LikeLike
nice analysis! this is one of my favorite aspects of online scoring (free data!!), and also eventing in general (and its focus on the numbers). looking at the actual venues from a broad perspective like you did (vs the analysis i just did of my own personal dressage scores) actually gives you a lot more room to play with all those other variables that seem to catch everyone’s attention, like weather.
for instance, you could connect each venue’s average # of clear rounds per event with general ground conditions (good, fair, poor) or temperatures and see how your charts might change depending on that. is Holly Hill a pretty easy romp for Training in good conditions, but a terrible disaster in the rain?
LikeLike
Funny, there are a couple of events that I knew for sure had significant weather issues/mud/footing challenges (cuz I was THERE) and the only thing that really changed was the number of W’s. The actual % of clear rounds was not particularly affected for any of them.
LikeLike
honestly that doesn’t surprise me. i think weather conditions weigh heavily on many rider’s minds (myself included) – but i’m not sure it’s as influential as we believe. and, should that theory be supported by the evidence, it could potentially go a long way towards reassuring riders that a little rain or mud *won’t* hurt them, and that they shouldn’t actually withdraw. which could then impact the outcome of shows in bad weather somewhat meaningfully (like that time i eked out a 2nd place at fair hill bc a couple riders ahead of me withdrew)
(also plz don’t mind me while i geek out over here…. #mathisonehelluvadrug)
LikeLike
The only thing I really noticed about bad weather events in my (granted, fairly limited) data gathering was that time faults went up. Jumping faults, not really, rails, not really, time faults yes. Obviously, people just slow down a bit, but the jumps still seem to work out the same regardless.
LikeLike
Oooh, I like what you did there with the maths! Too bad USEA doesn’t report the same thing…
LikeLike
Feather Creek’s stadium course is in a very large grass ring and when I was there for a schooling HT last month, it was a pretty short course without a lot of technical questions. If I remember correctly, it was like, vertical to 4 stride to oxer to 3 stride to vertical to 2 stride. It rode well and was a really pleasant course with plenty of time to set yourself up correctly.
I’m surprised there aren’t more faults on their XC- maybe it’s because I went to a schooling event, but the XC was a hot mess when I saw it. Weird distances, sketchy footing, really, really overgrown grass all over the place. It’s the only event in Oklahoma and about 2 hours from me, so I’ll probably end up going next spring though I was kind of dreading it. Your data makes me feel slightly more positive about their recognized event!
LikeLike
I think sometimes the numbers do have a lot to do with what kind of people the event attracts. For example – Corona is constantly billed as having “good move up courses”, so a lot of people show up expecting something soft. It’s NEVER soft, they’re always pretty stout. So for those I think a lot of the XC problems are because the people that show up are less experienced or on green/inexperienced horses, and they aren’t really ready for what they encounter on XC.
LikeLike
I wonder if the high number of clear XC rounds at Texas Rose might also have to do with having the AECs there. Probably, people coming to the AECs are more qualified to jump around an XC course than those going to a standard event, because they have already qualified for AECs! Of course, this hypothesis doesn’t hold with the training level data.
Also, I wish the USEA would hire me to do THIS as my job. I’d math the shit out of some events!
LikeLike
Texas Rose has 3 other events per year besides AEC. I didn’t actually include AEC in the data, because I noticed that there were fewer clear rounds at Championships than there were at the regular Texas Rose events, which makes sense because the courses are harder. It didn’t seem “fair” to put National Championships in with the other data.
LikeLike
Oh wow, even more interesting!
LikeLike
Math and I are not friends. I could never have done this, haha
LikeLike
#dataisbeautiful
I LOVE this. PIE CHARTS NEXT!
LikeLike